
Feature Based Point Cloud Registration
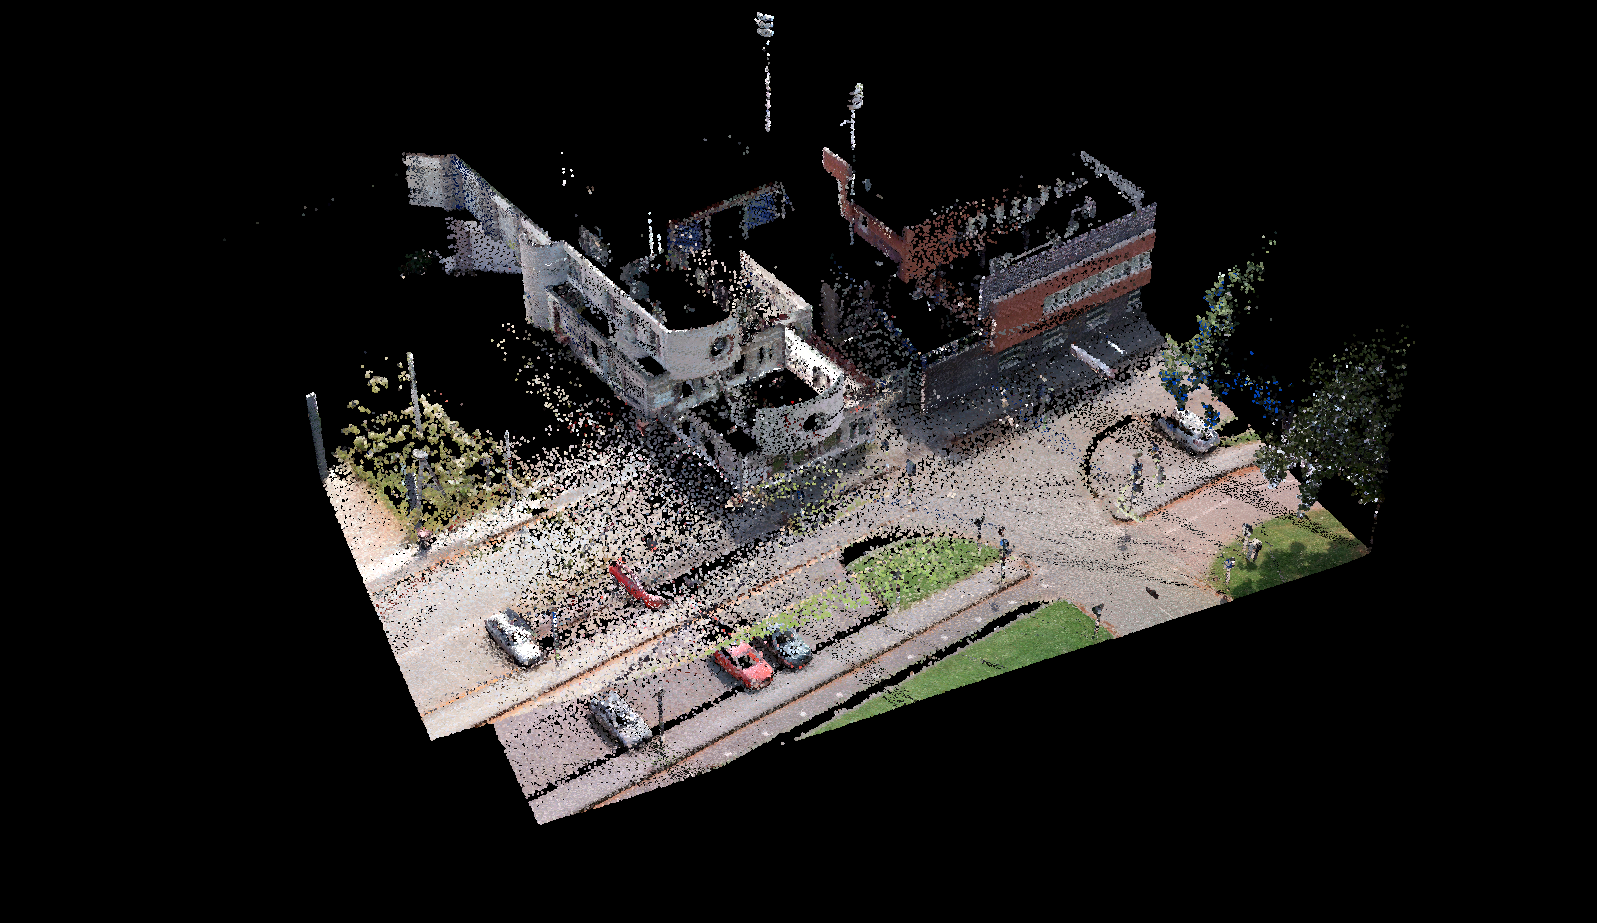
During my first internship at Cyclomedia I explored many methods for point cloud registration based on different features. I developed an innovative method that encodes point clouds as images, improving both computation time and accuracy, while retaining equal precision.
After this internship the method became a standard component in Cyclomedia’s positioning pipeline.
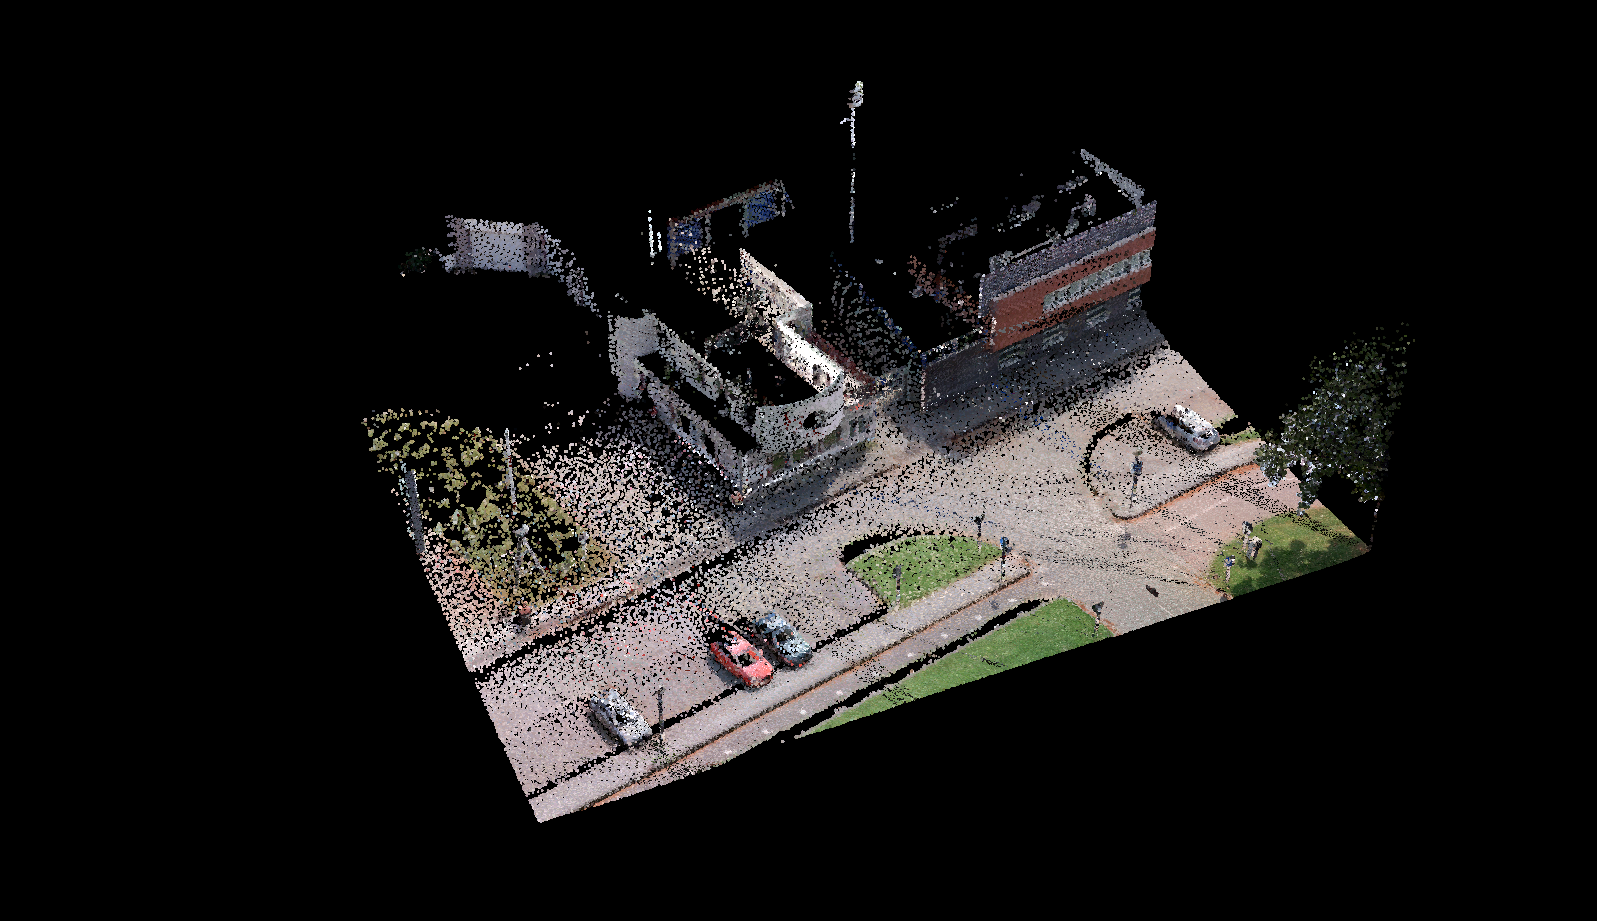
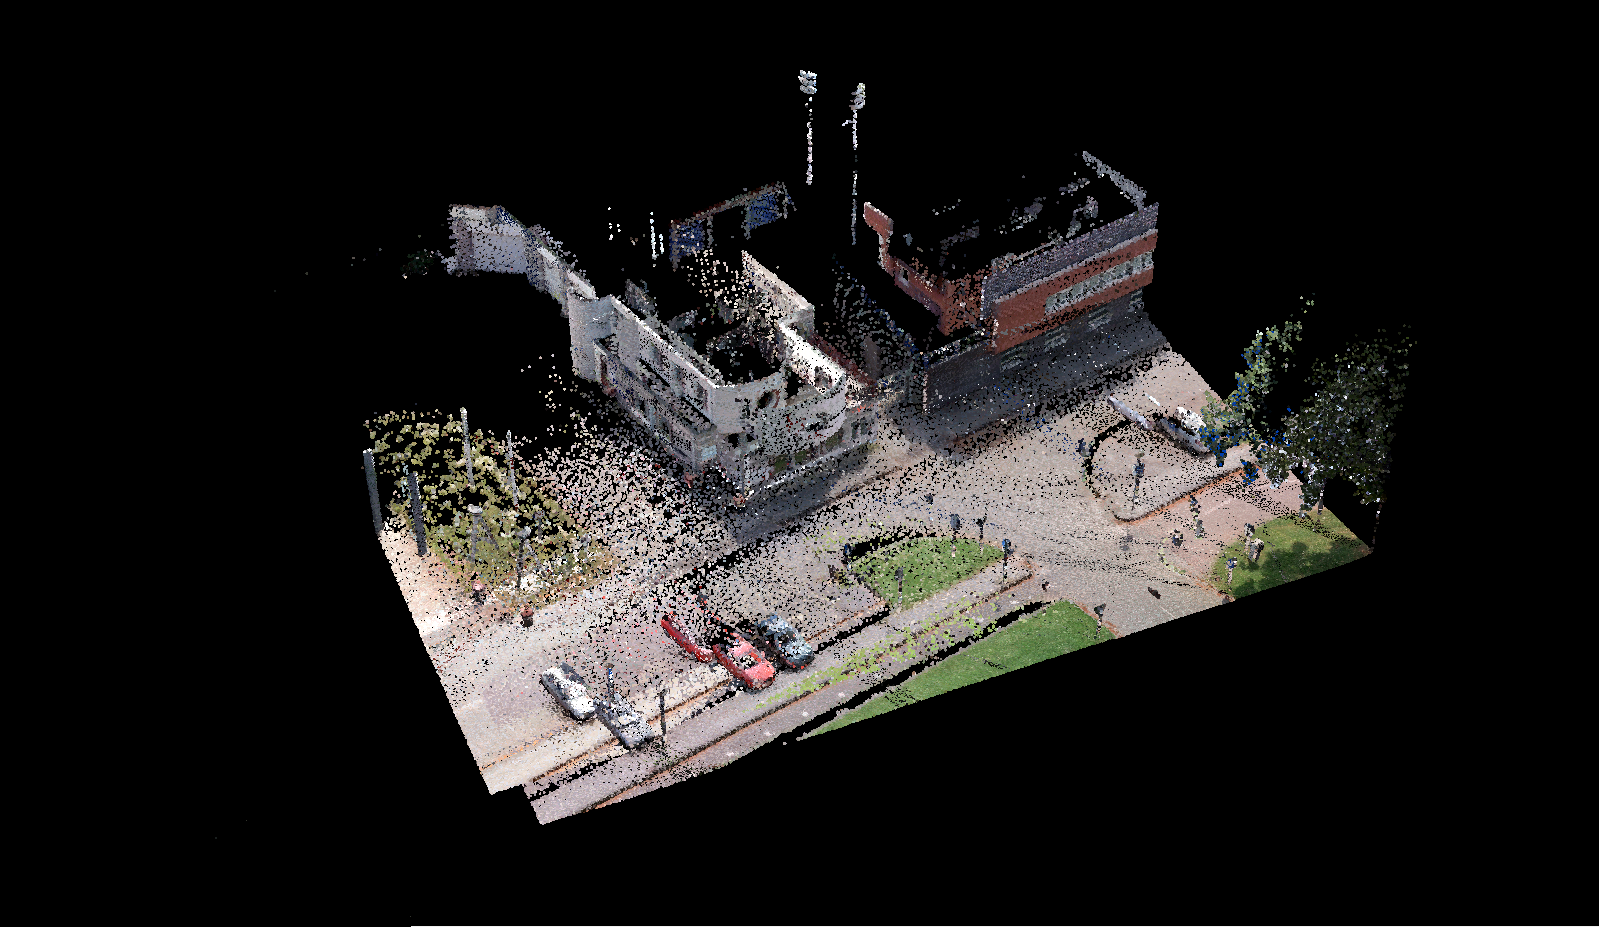
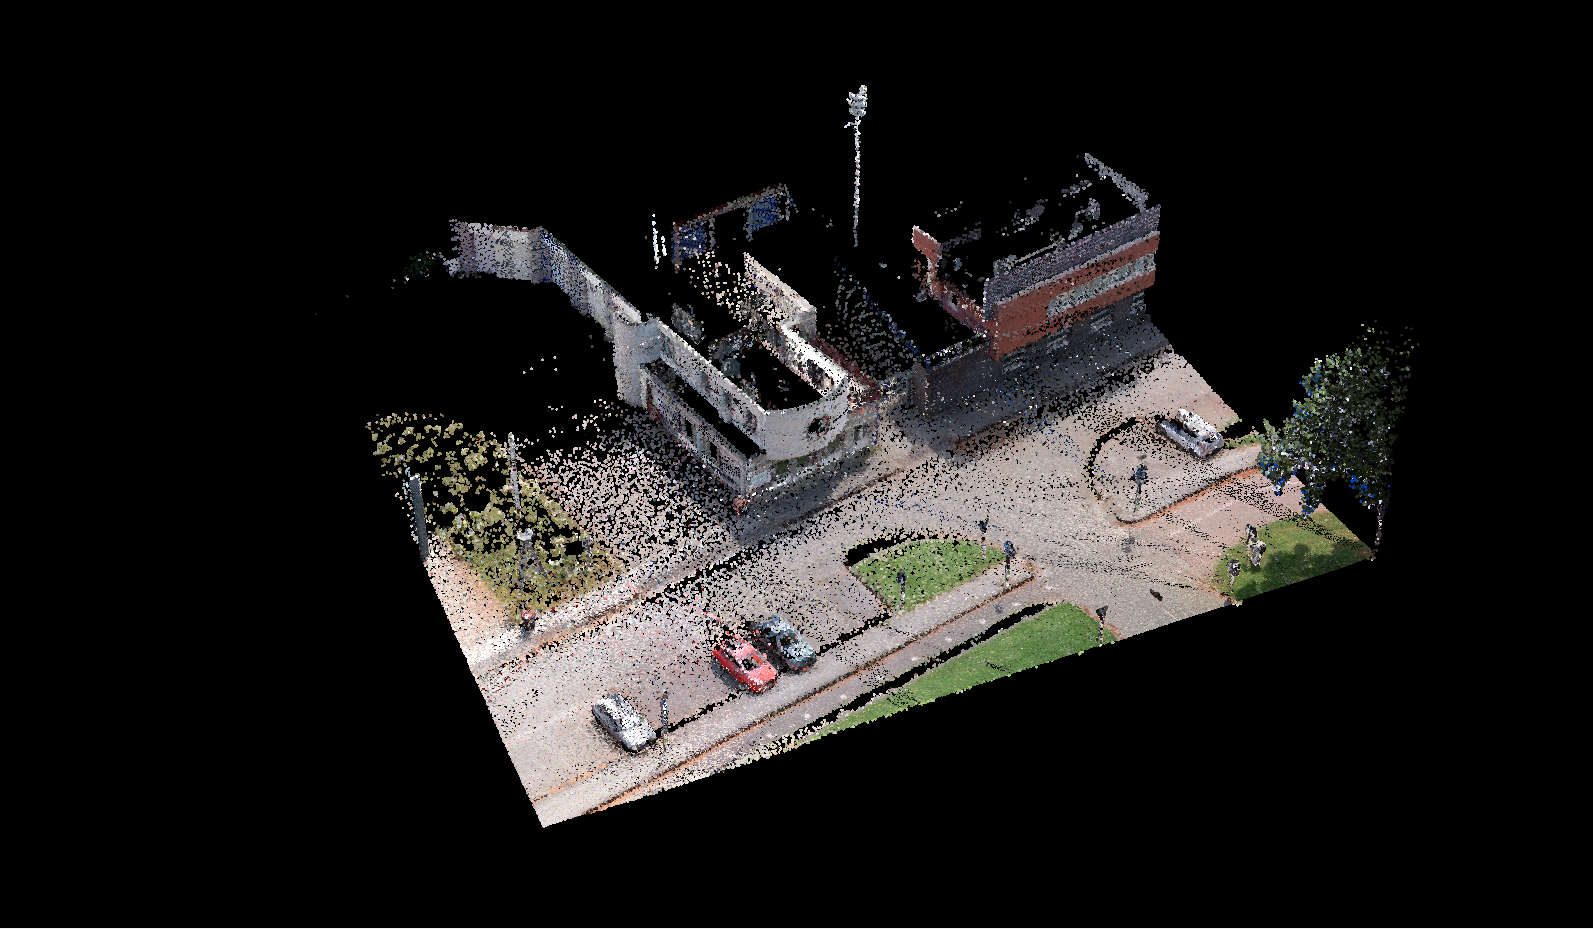
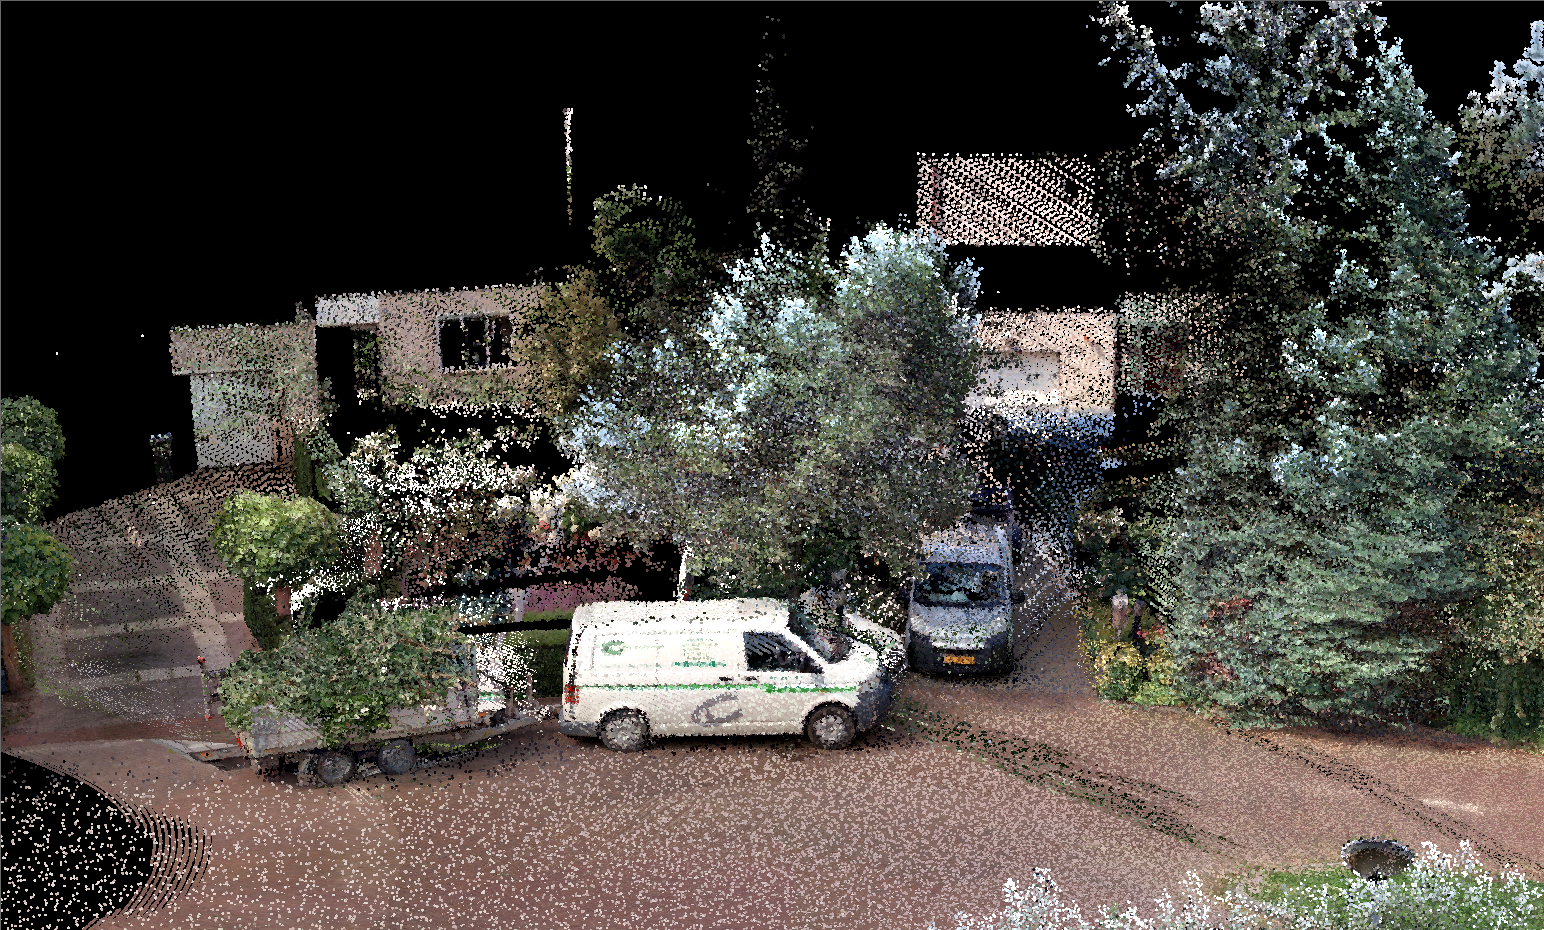
Cyclomedia is a company that records the publlic space with full 360 degree spherical panoramic images and Lidar laser scanners, mounted on top of driving cars. That data can be used to create 3D reconstructions of the real world that are so accurate, that they can be used for measurements, inspection and inventorisation, without the need for someone else to visit the place in person.
When data is recorded at different times, the positioning might deviate a little bit. We want to consistently align many point clouds, covering entire countries. The process for doing so is called point cloud registration.
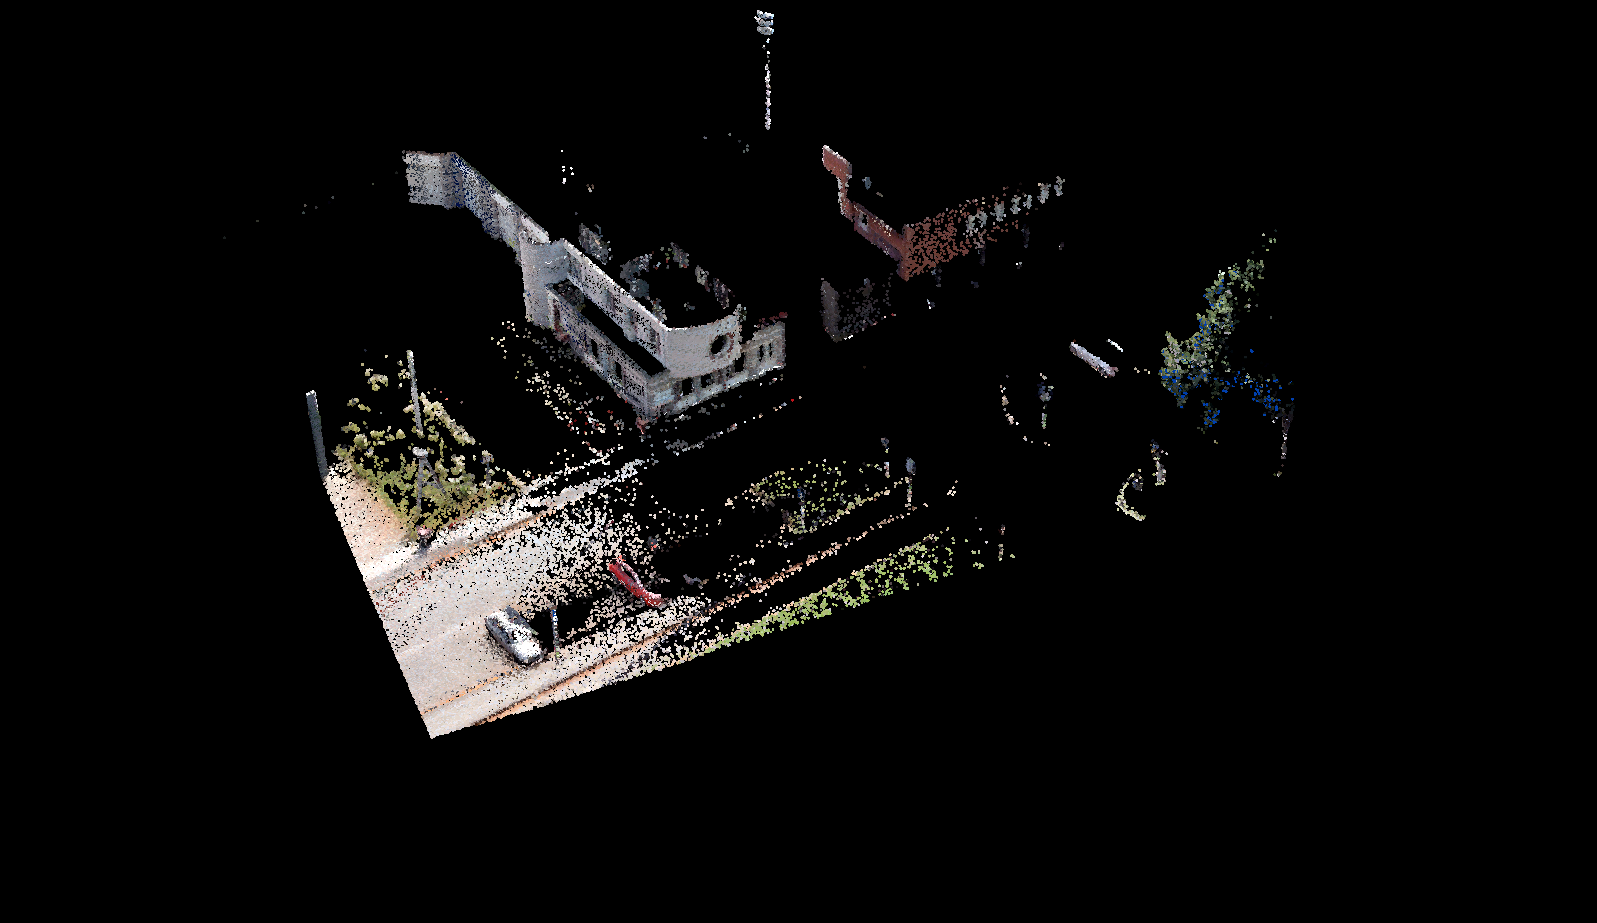


Point clouds can be registered based on different features such as; targets, key points, lines and planes. The transformation between the feature sets can then be found using for example RANSAC. During this internship I experimented with Harris keypoints, SIFT keypoints, ISS keypoints, Planes, Normals and a custom solution based on density histograms.
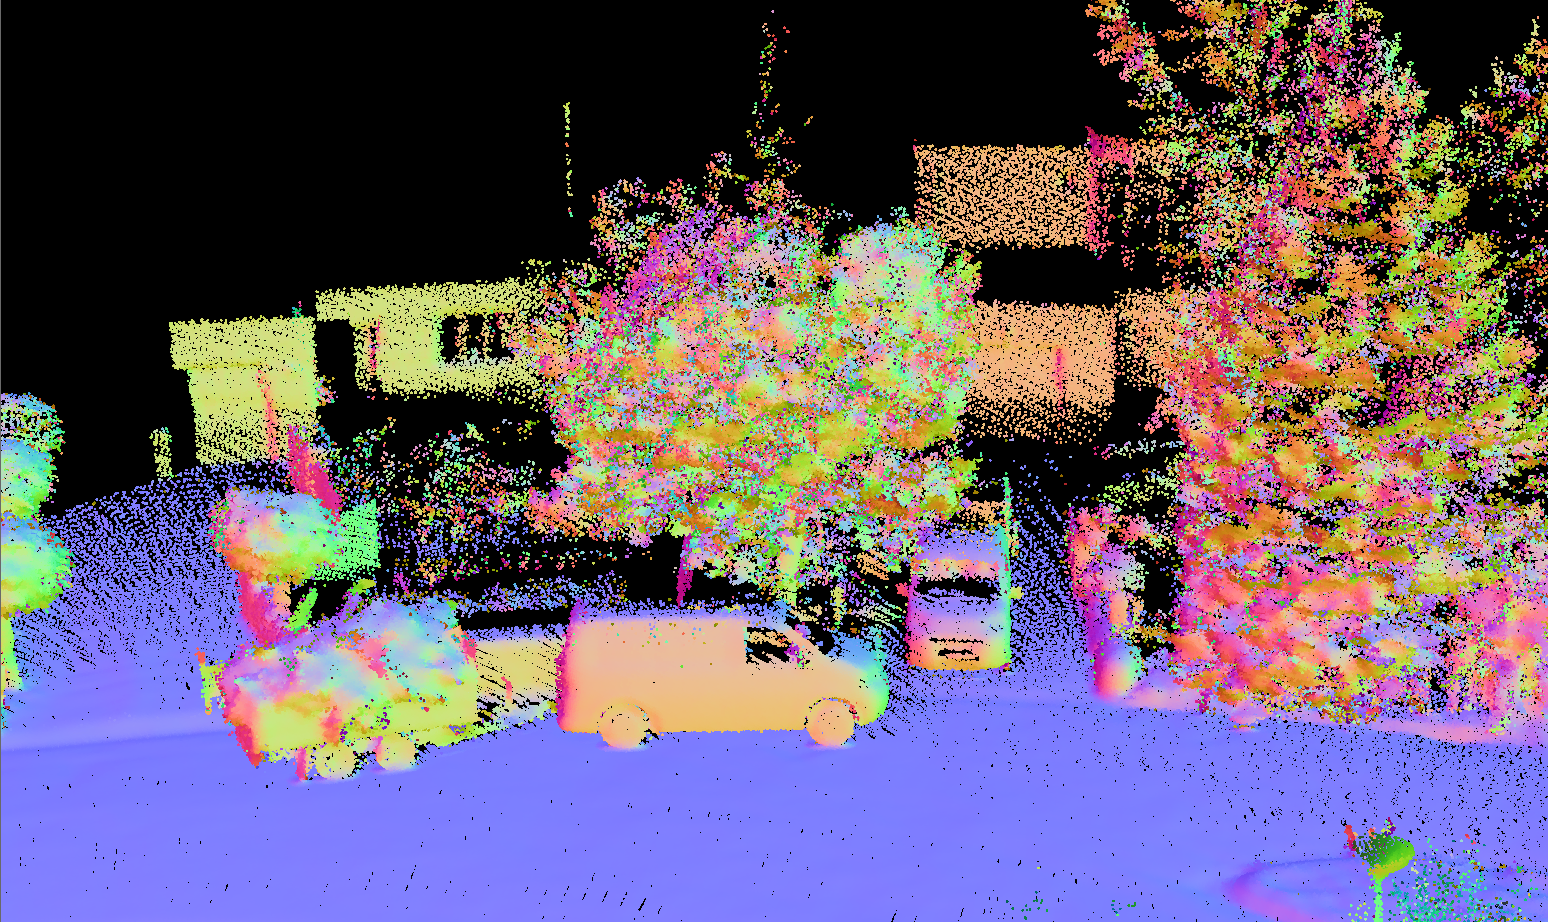
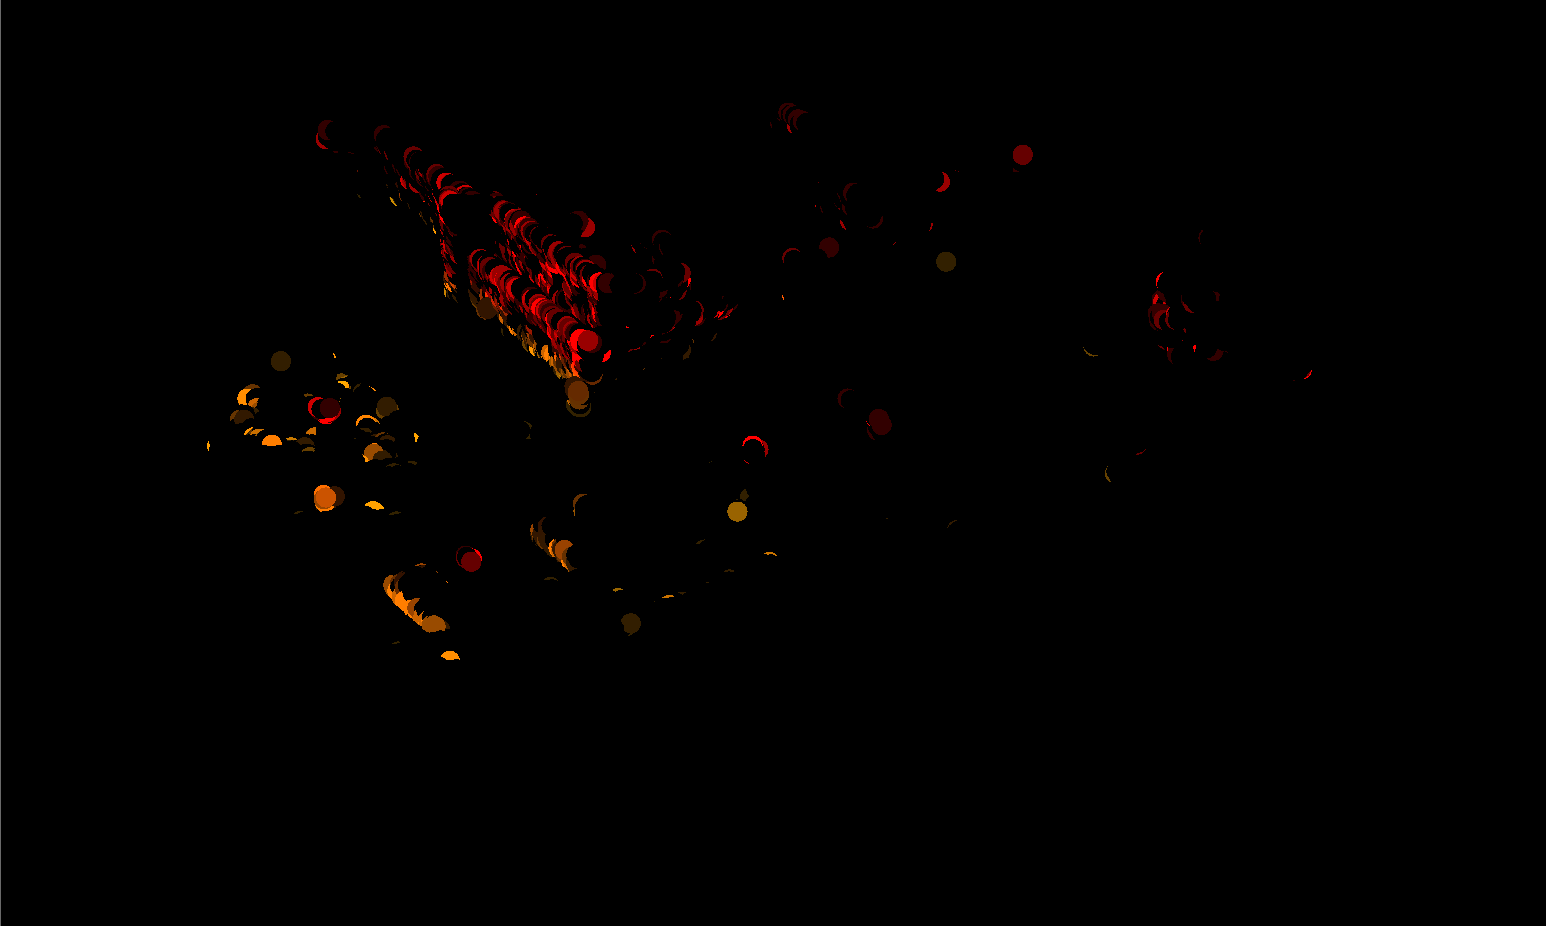
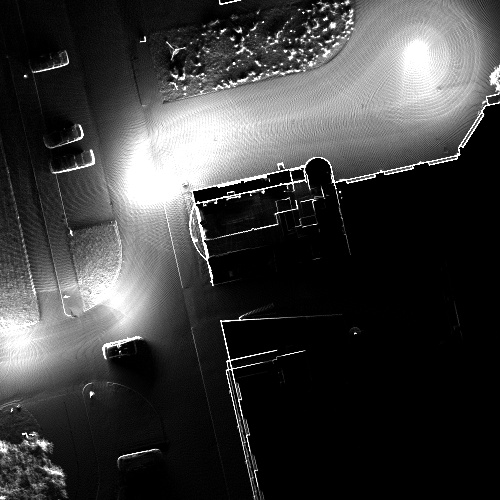
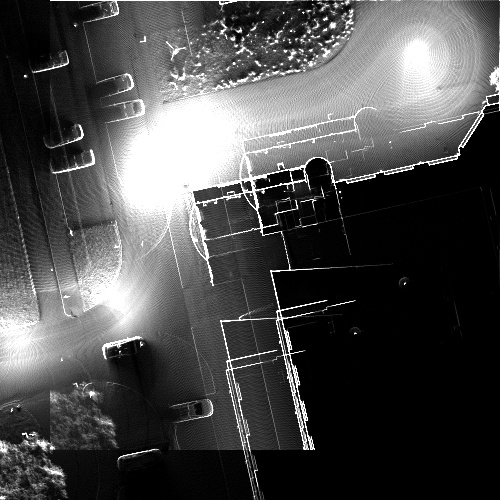
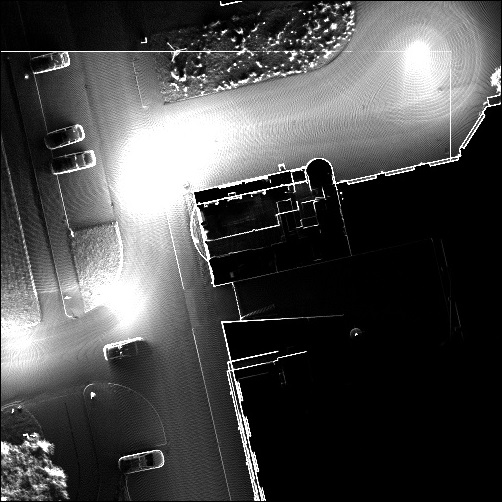
We saw that commonly our point clouds were only a little off in their height, but needed more finegrained registration in the xy-plane. I came up with a custom method where we create two histograms; one along the z-axis, and an image representation capturing the xy-plane. For the xy-histogram we basically project a grid over our point cloud and count the number of points per cell. These histograms are then simply used as images in a template-matching approach.

Experiments illustrated that the new method improves both computation time and accuracy, while retaining equal precision.