
Street Ortho Lidar
For my work at CycloMedia I worked on a project called Street Ortho Lidar, where we tried to create images similar to aerial photographs from our street-level imagery. I think the project was a lot of fun to work. I’m quite proud of it as well because the results are great and I developed the entire product almost entirely on my own.
Street Ortho Lidar images are created by combining and reprojecting street-level-imagery as if it were an aerial image. The red colors illustrate everything that is between 30 centimeters and 3 meters above ground level, while the green colors illustrate everything that is 3 meters or more above ground level. Because the Lidar scanner can penetrate translucent materials such as glass, or when people have their doors open, you even see the insides of buildings. The resolution is so high, that you can almost count the bricks in the road!
One of the bigger drawbacks of the technique is that we only have data in locations visible from the road. Street ortho lidar is therefore not meant as a replacement of aerial imagery, but as an addition. The most complete and intuitive results are achieved by using aerial imagery as a base map, and using street ortho lidar imagery as an overlay on top of that. The context in areas where data is missing can also be made clearer through the color-coded height layers. You can for example see on the left side that the trees are not visible in the image. They are filtered out because we mainly want to visualize the gorund level. However, as a result, it is not obvious that the big dark blobs on the street are shadows of the trees. By including the trees via the color-coded height layers, the shadows ar emore easily identified, and the big benefit is that the color-coded height layers can be toggled on and off, whenever the user wants.
Background
Before I can explain the details of the project, I should explain what CycloMedia does as a company. CycloMedia records the public space using panoramic images recorded at 5 meter intervals, and Lidar point clouds which are recorded continuously, all from systems mounted on top of cars (and sometimes even boats). They do this in different parts of the world including The Netherlands, Germany, Scandinavia and the USA. The data is available through an online portal called Street Smart which is similar to Google Maps, but which is updated every year, and has a highly accurate underlying geometric 3D model, which could be used by users to measure about anything, from positions of objects to slopes of roofs and volumes of buildings.
I work as a computer vision scientist in the data analytics team, where we apply state-of-the-art computer vision and deep learning techniques to automatically process the data further, and detect all sorts of things, from faces and license plates to street lights and fire hydrants.
Features
In the Street Ortho Lidar project (SOL) the goals was to create imagery similar to aerial photographs from our street-level imagery. Our version has several benefits. Since we create these images from our street-level imagery, we have data from underneath trees and viaducts; data that is not available in aerial imagery. However, we only have data of areas that are visible from the road. Our SOL imagery has a higher resolution than aerial imagery because it has been recorded from nearby. The resulting images have an orthographic projection, which preserves object shape and scale. Also, since we can intelligently combine images from multiple timestamps, we can filter out moving objects. The resulting street ortho images are geo-referenced so that they can be automatically overlayed on the correct place on the map, if you open them in a GIS package.
Implementation
I'll keep the description of the implementation short.
For every scene, the corresponding recording trajectories are split or combined based on time, height and distance between recordings. In an environment with a viaduct there are for example two levels; one for the lower road, and one for the upper road. A street ortho image could then be created per road.
The lidar point clouds are combined and meshed. By ray-tracing vertically through the mesh, we can find the corresponding height for every pixel in the desired output image. For every point (and thus the corresponding pixel in the image) we then create a list of recordings that observe that point. Occlusion-tests are also performed using ray-tracing.
From the list of candidates we choose the best color for a pixel
by using Loopy Belief Propagation,
which we configure to optimize colors based on
recording continuity
(neighboring pixels from the street ortho image,
are preferably colored using the same panoramic image),
recording distance
(closer recordings are more trustworthy)
and color smoothness
(the color difference between neighboring pixels is expected to be small,
and contrast could always be restored later).
Because the resulting colors can still have discontinuous at boundaries between areas originating from different recordings, we apply multi-band blending for further color smoothing. Some contrast is then restored through a sharpening image convolution.
Because the process can result in ugly disattached blobs of color in the images, we clean the images using a morphological opening operation. This also smoothes the boundaries between places where we do, and where we do not have data.
Results
Here I'll show some of the resulting output from the Street Orhto Lidar Pipeline.
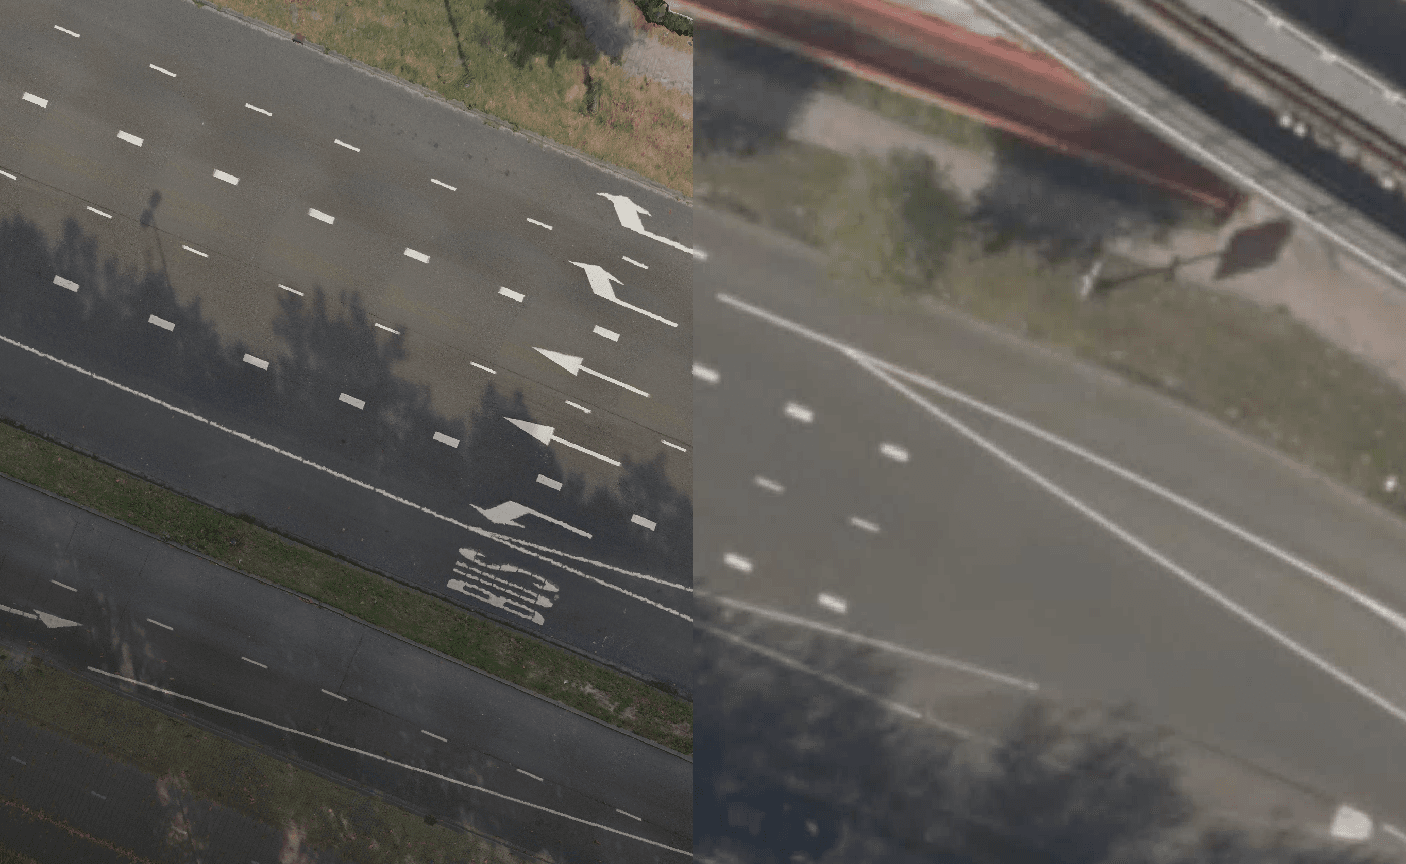
This image shows street ortho lidar imagery on the left side, and aerial imagery recorded from a plane on the right side. As you can see, street ortho lidar imagery has a muchb higher resolution, which makes it much easier to see for example road markings, and makes it easier to interpret the scene.
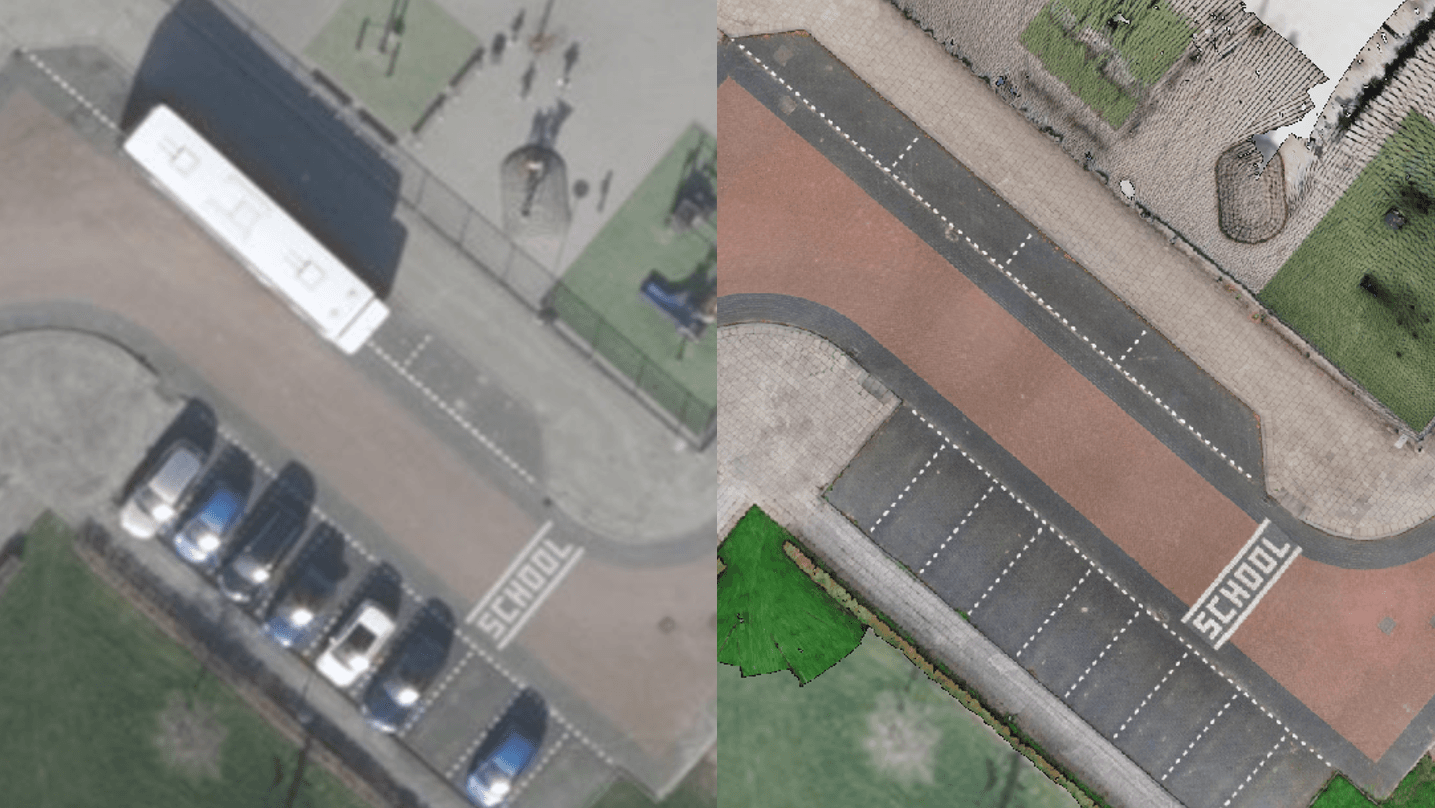
In this image, with aerial imagery recorded from a plane on the left side
and street ortho lidar imagery on the right side,
you can again clearly notice how much easier it is to read the "school" road marking in street ortho lidar imagery.
When opening the street ortho image in a larger view, you can almost count the bricks in the sidewalk, while that is absolutely impossible in the aerial image.
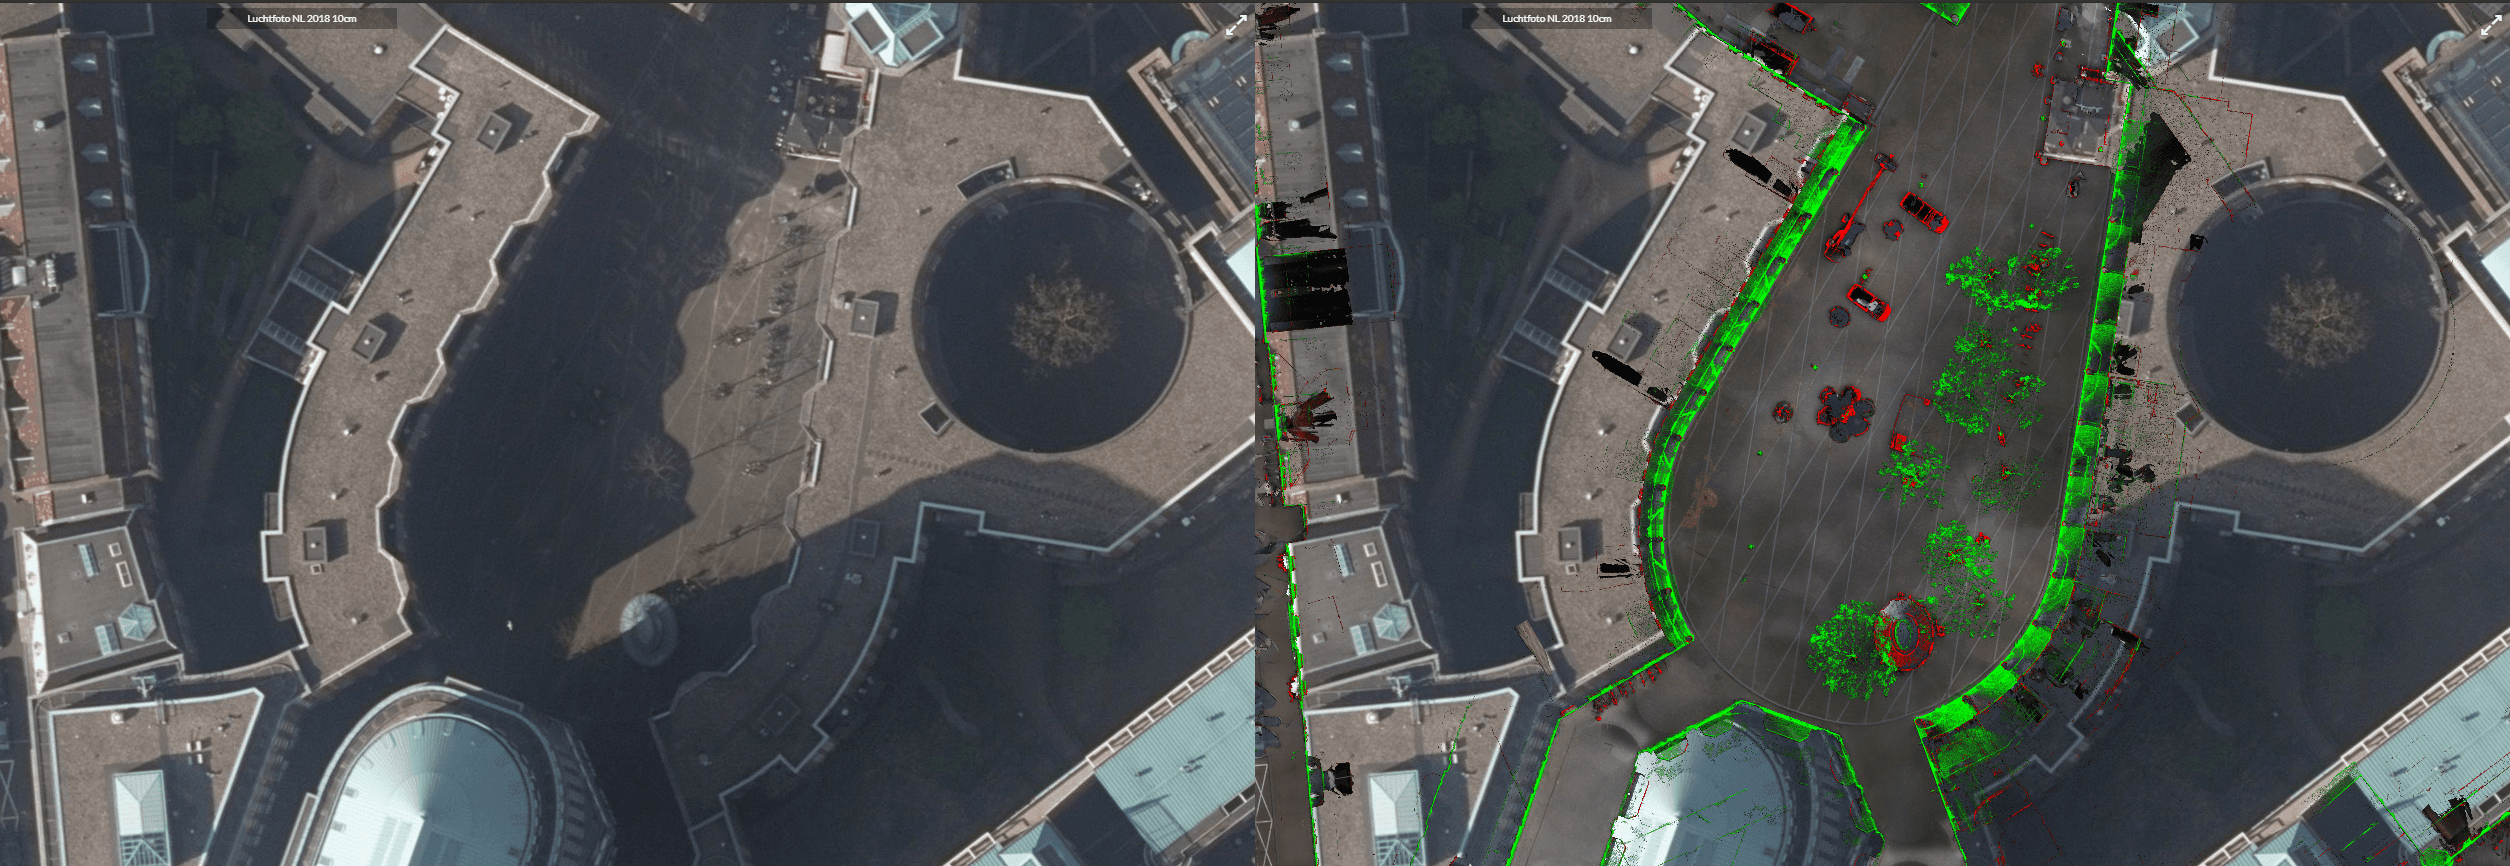
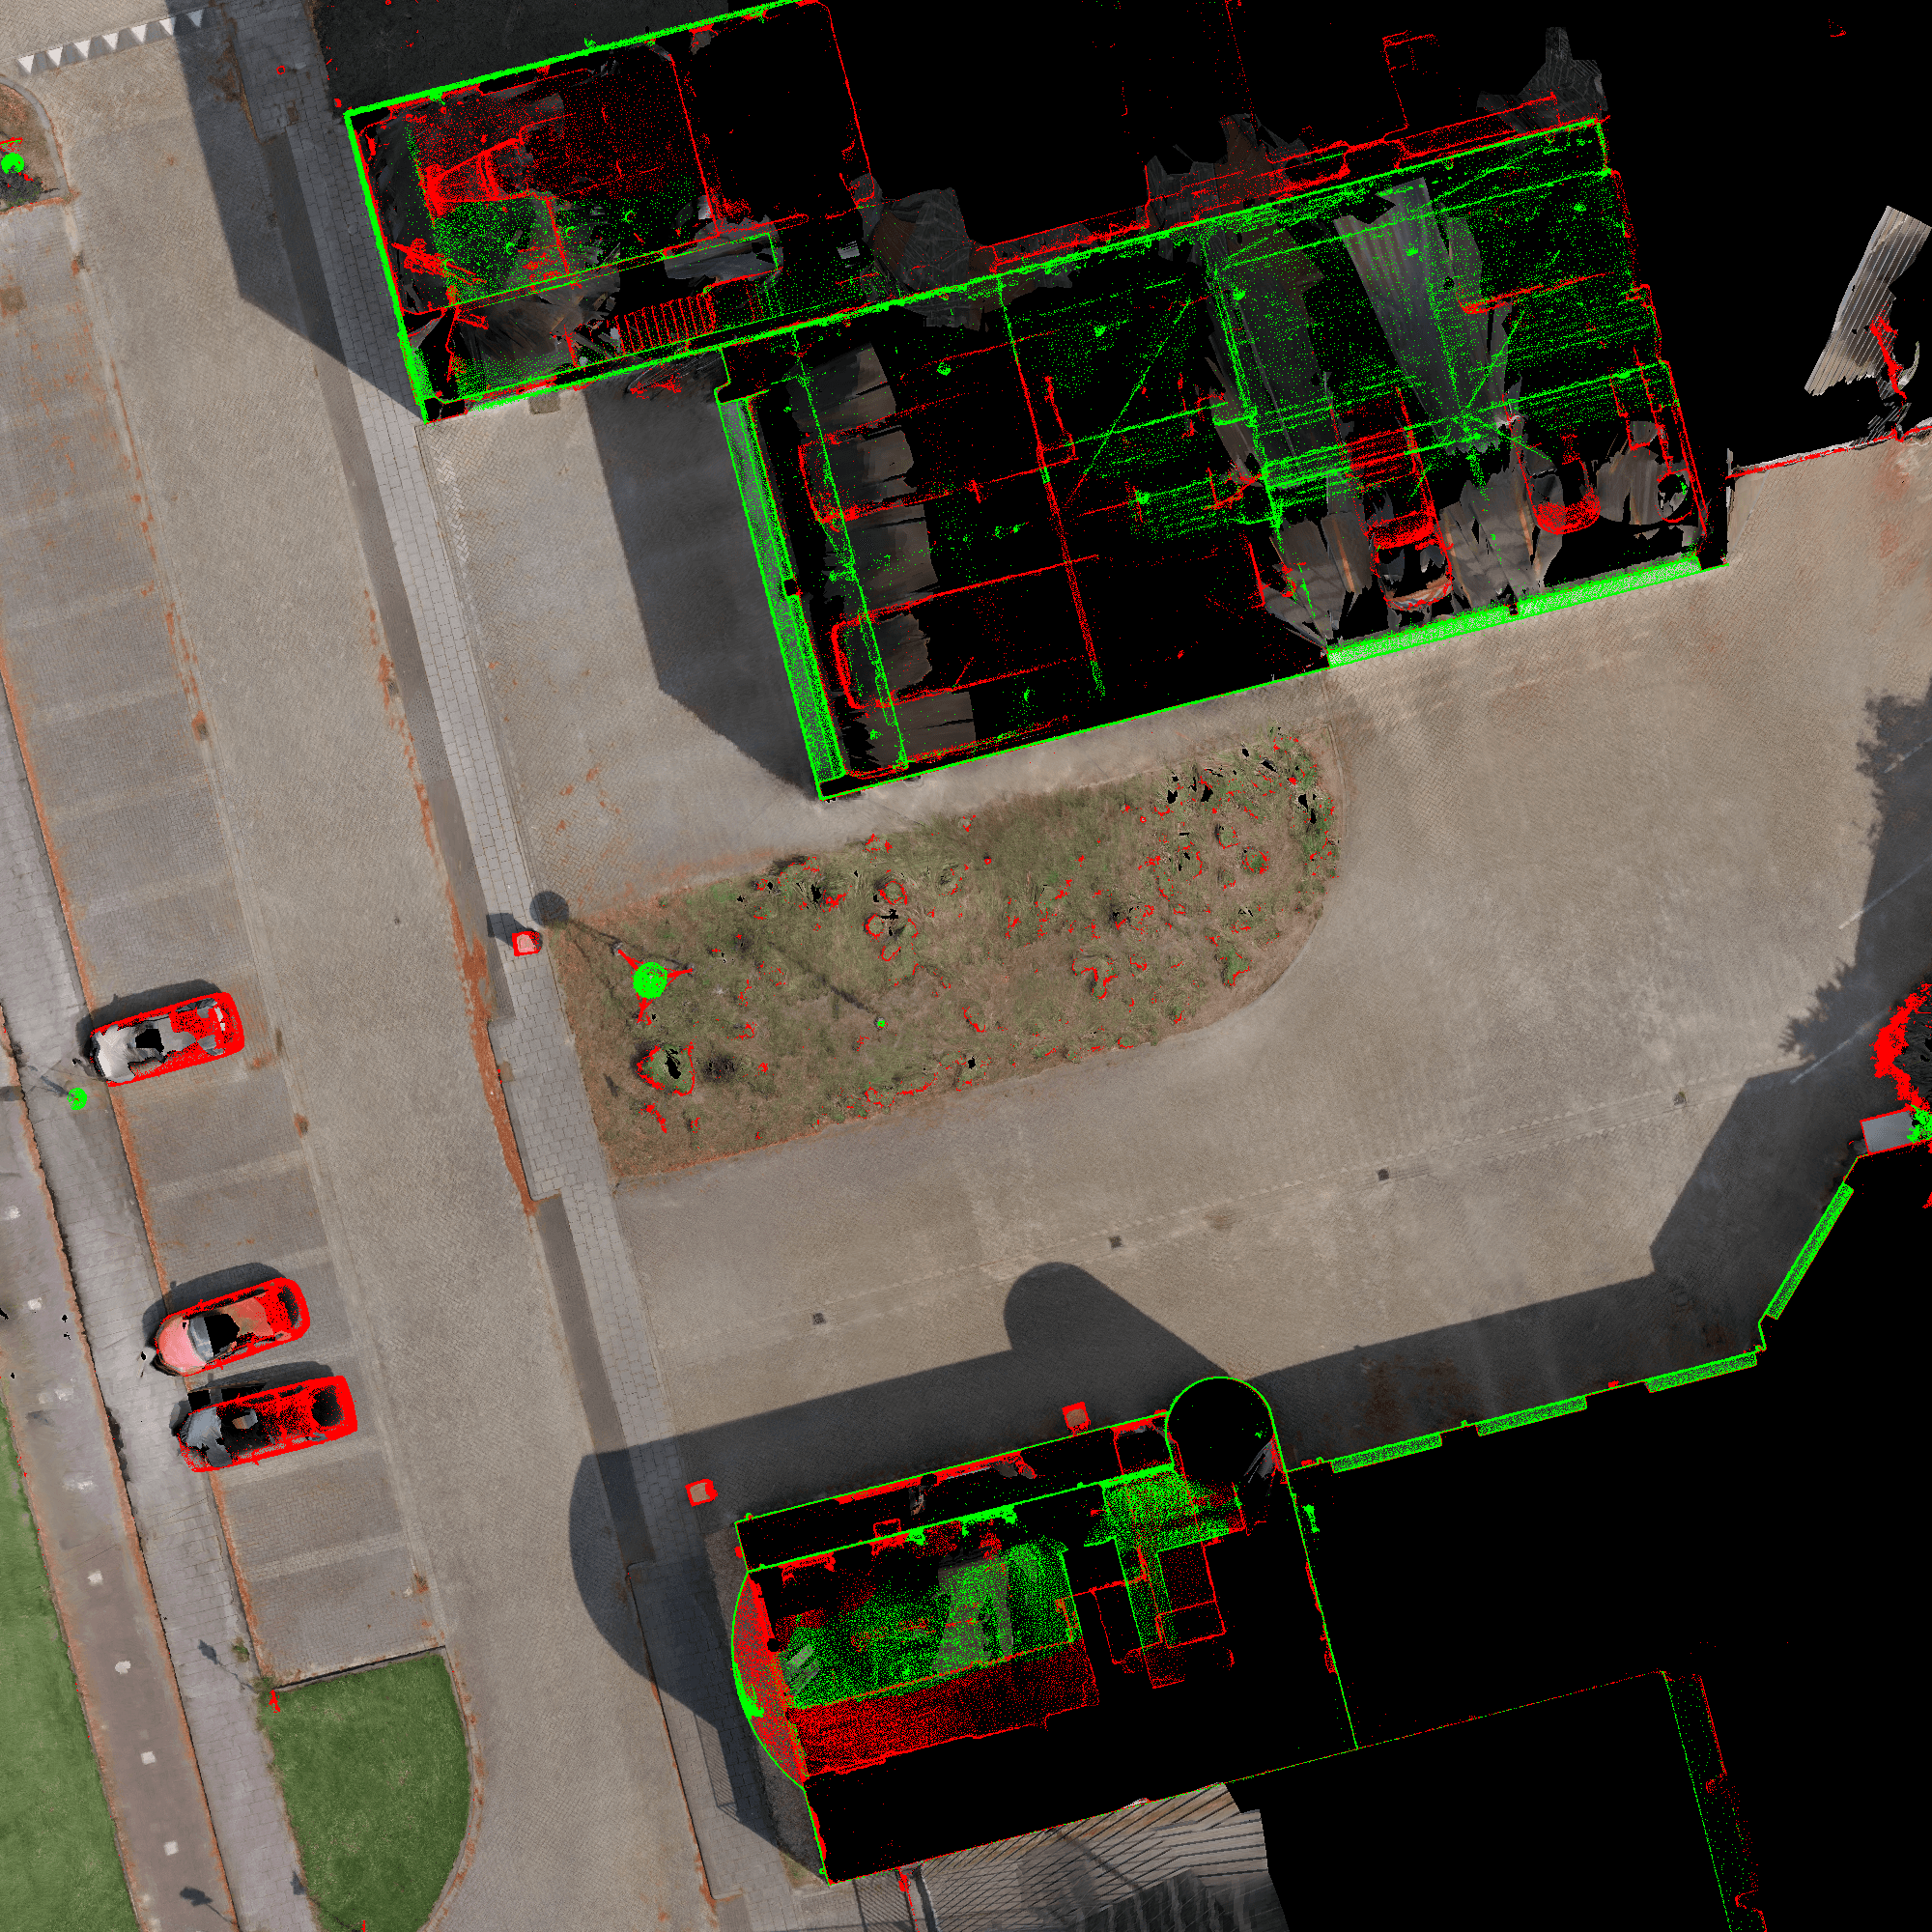
In this image you see the aerial image on the left side and the aerial image with street ortho layed on top on the right side. Note 'that the street ortho lidar images contain only ground level data. The rest of the image on the right side is still from the aerial image. In this image, you can see that, through some smart color blending and recordings of different timestamps, we can filter out shadows to some extent. Contrast is enhanced, and through the color-coded height layers, you can clearly recognize objects such as trees and cars. You can also see, on the left side of the right image, where there are gateways underneath buildings. What's also interesting to notice is that the building on the bottom has some 'lean' in the aerial image, and thus it occludes part of the street on it's left side. This lean doesnt appear in the street ortho image thanks to the orthographics projection, and thus the entire street is visible. due to the differences in projections, you can also see that the images don't fit perfectly around that building, and a part of the roof seems to be missing in the image on the right side, because the street ortho image replaces it.
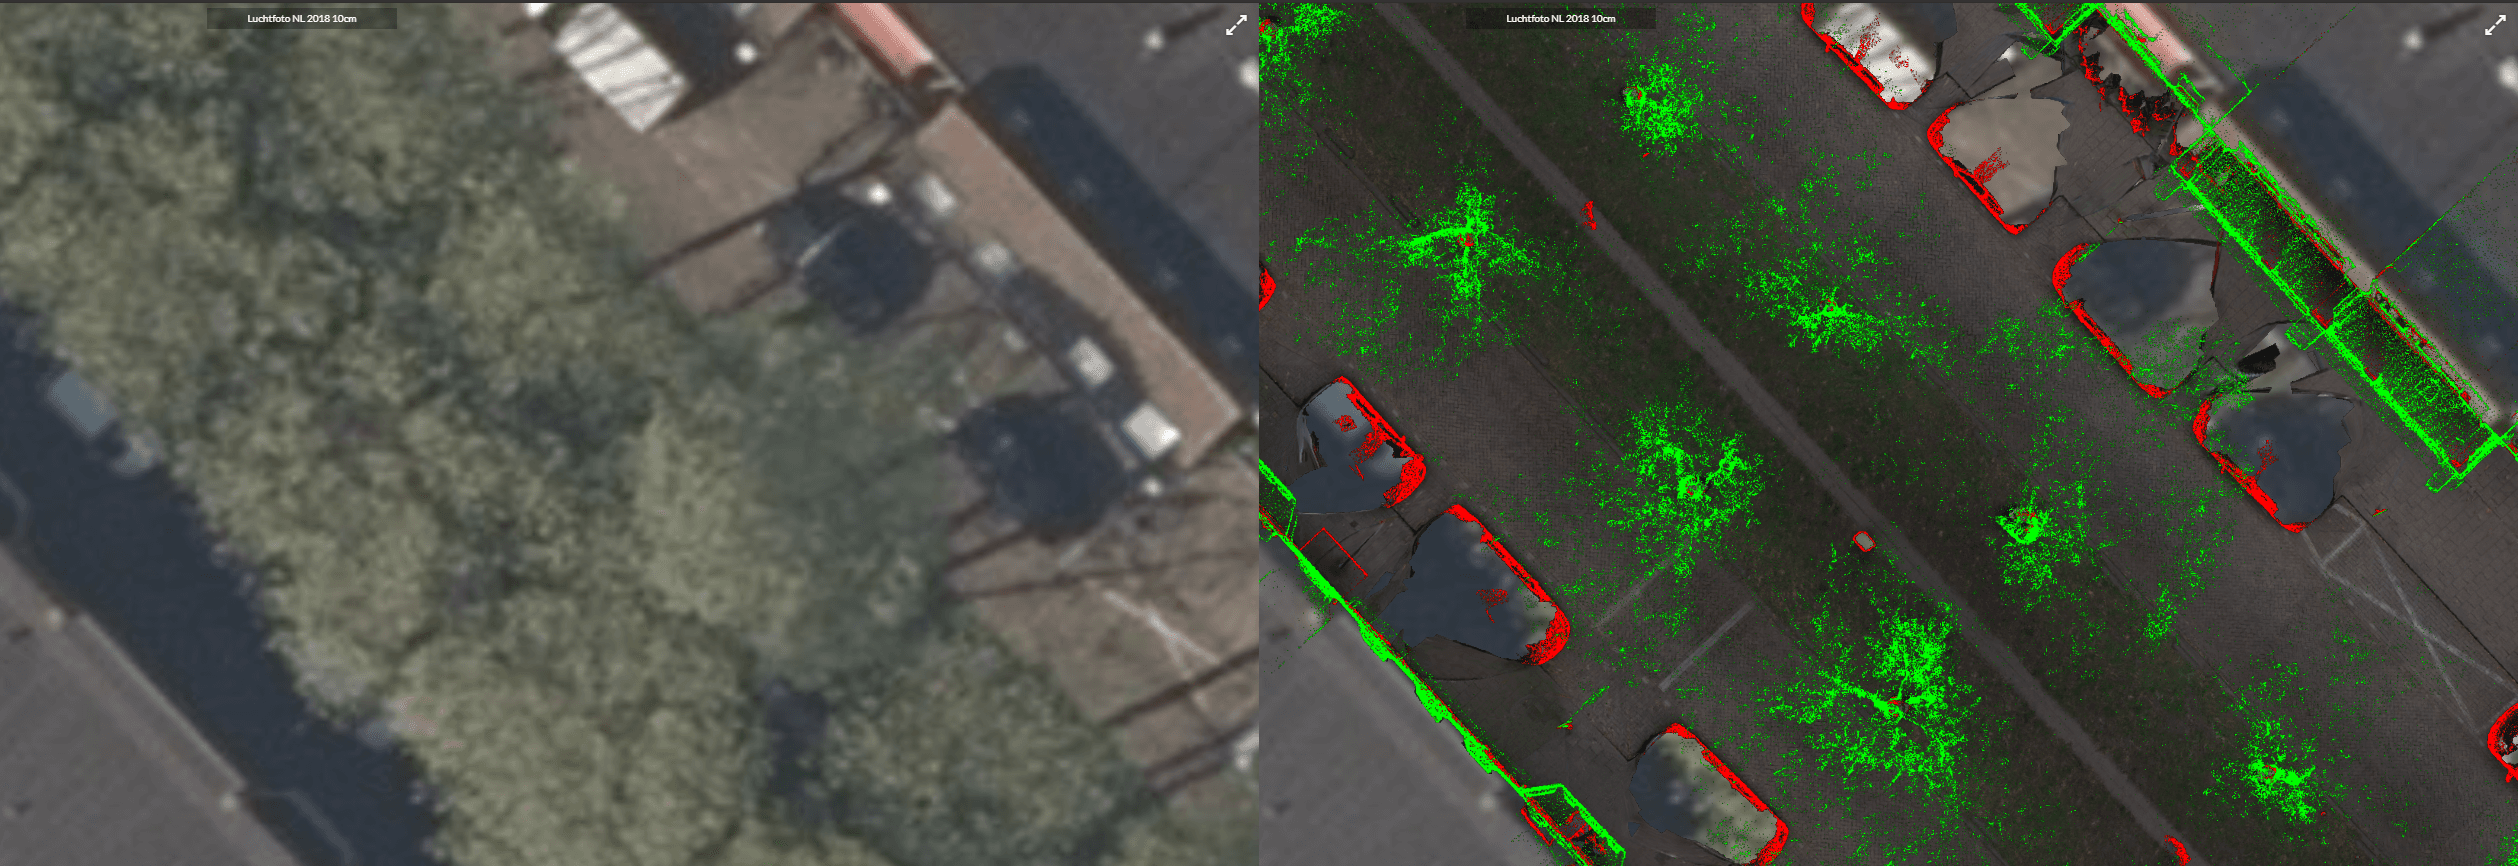
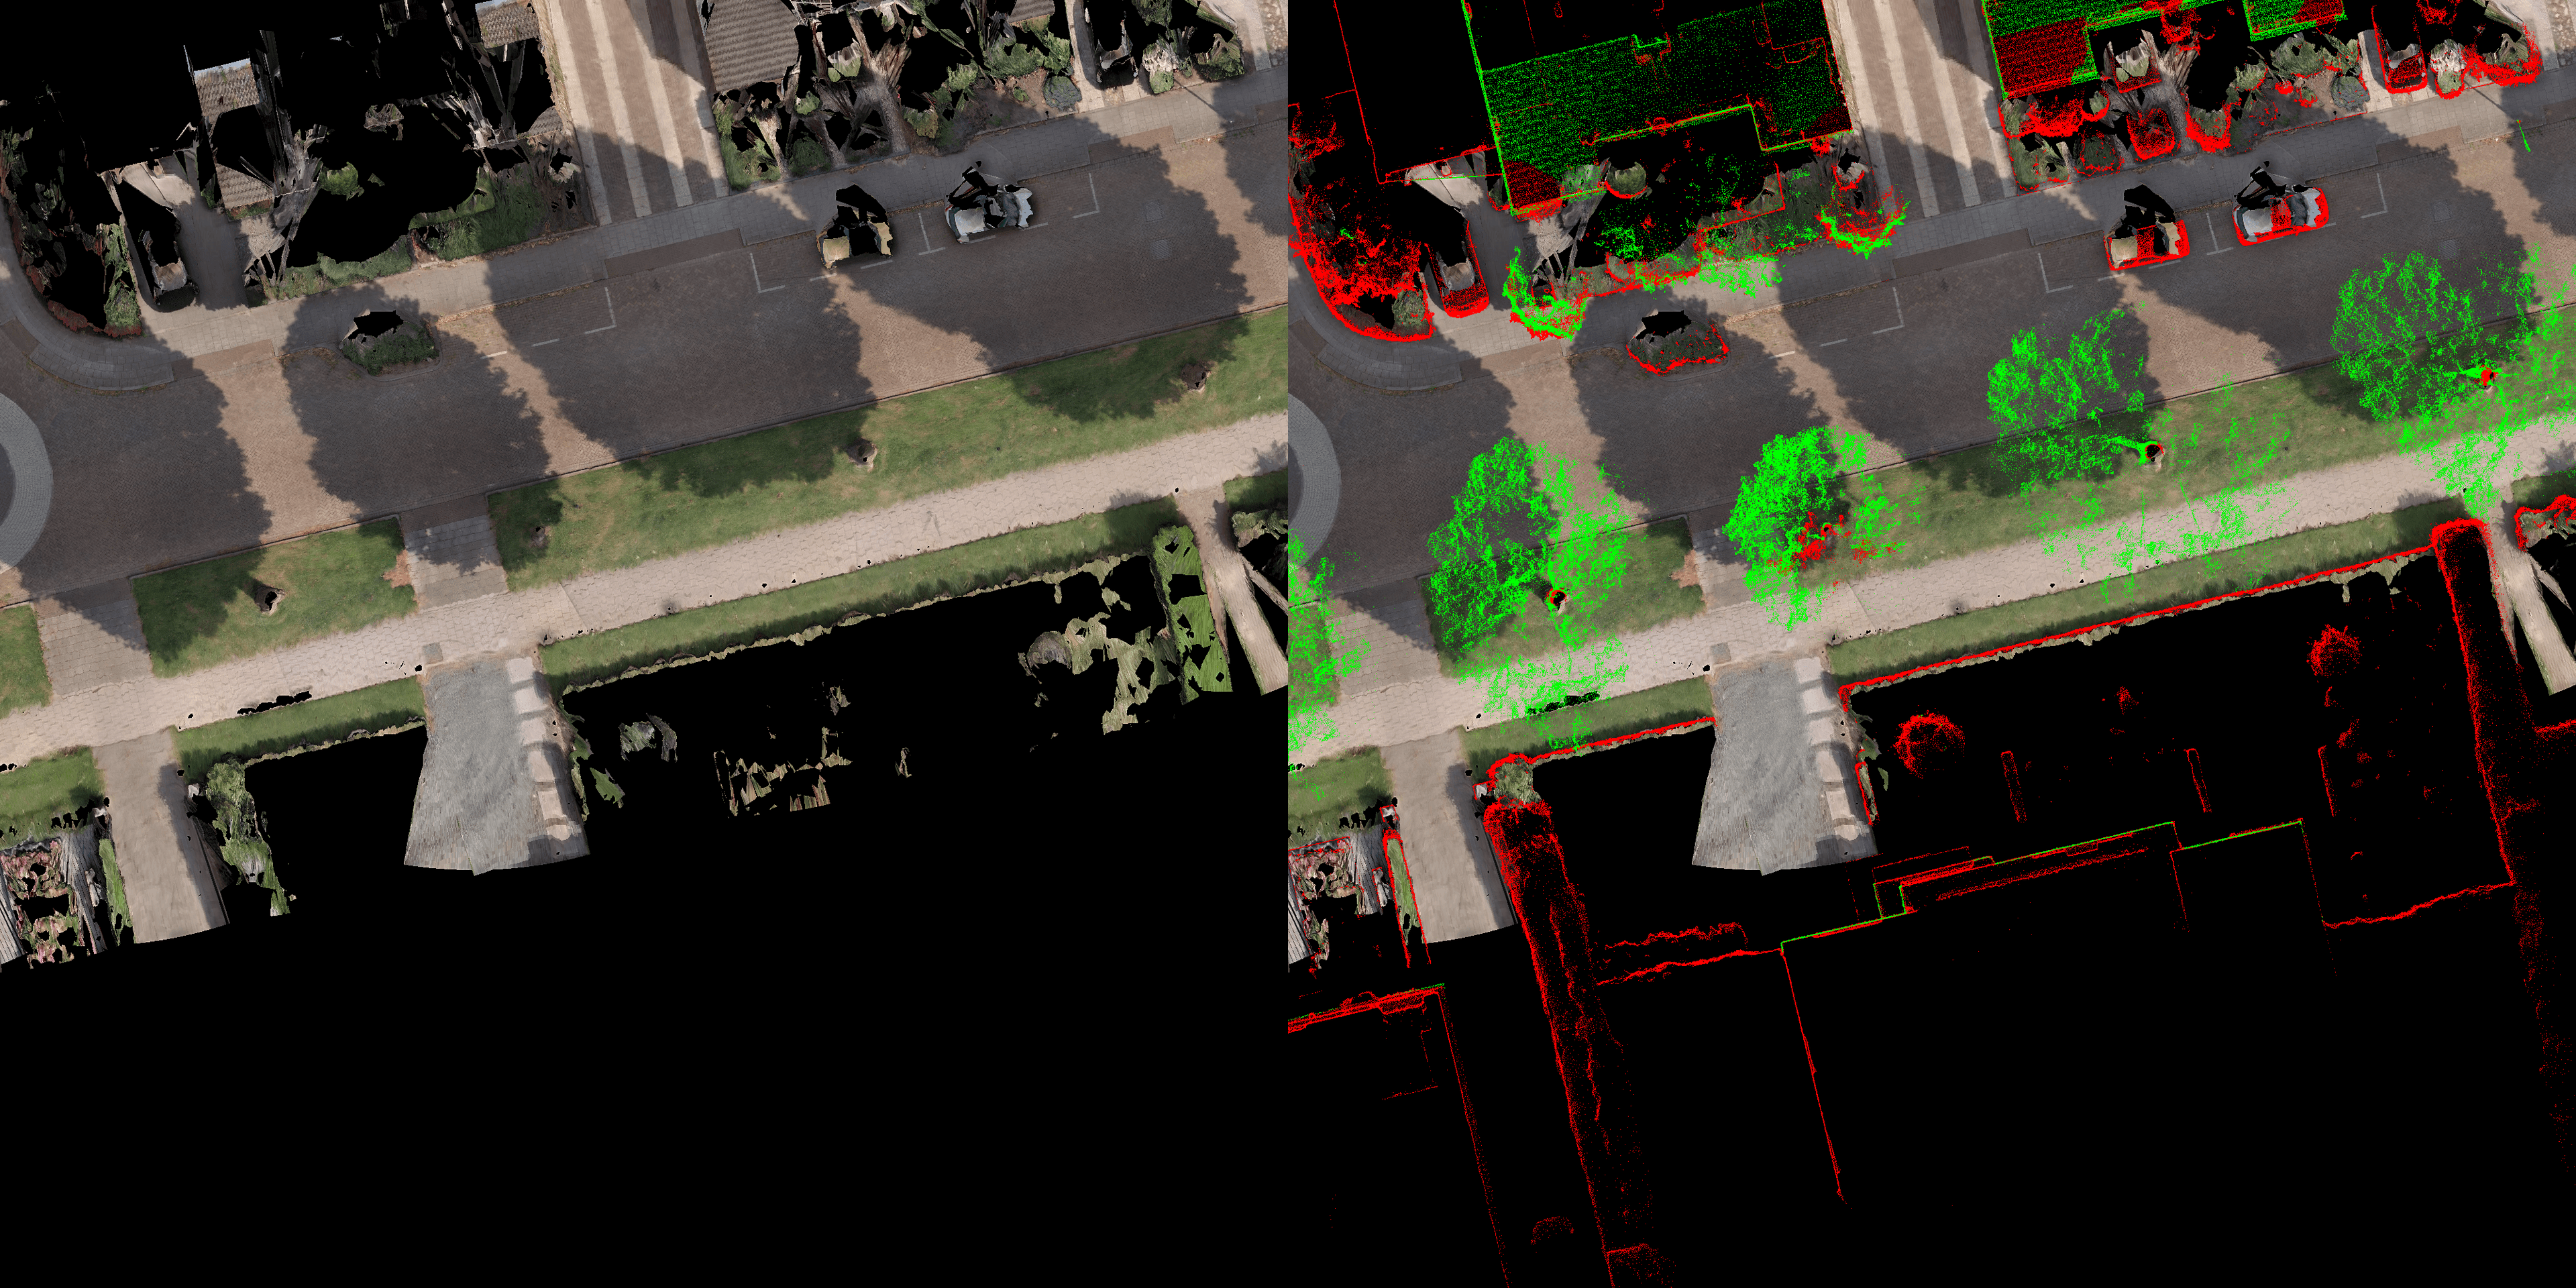
In this image, you can see that some streets are clearly visible in our street-level-imagery, while they are occluded in aerial imagery. The path underneath the trees wasn't even visible at all in the aerial imagery! The color-coded height layers provide additional context so that cars, trees and also building facades and balconys are easily recognized.
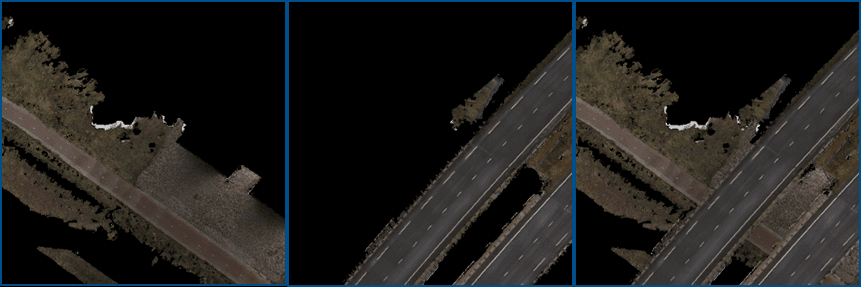
Because the recordings can be separated based on height level, we can also make separate street ortho images, for every level in a multi-layered environment. That means that if one road goes over another one, we can create an image per road. The user can then toggle which road should be visible, the upper one, or the lower one.
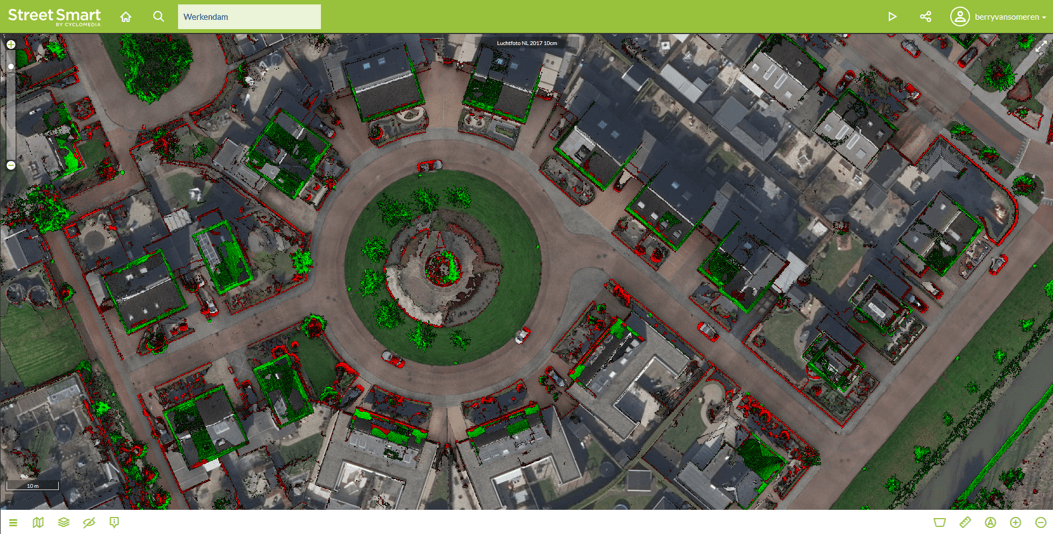
Street Ortho Lidar images can be viewed in our Street Smart application, where they are automatically overlayed on top of aerial imagery. Street Smart also allows users to inspect, inventorize and get the coordinates of everything, and measure distances, slopes and volumes, all with the combined power of aerial images, and street ortho images.